By Bev Clark, for the Lake of the Woods Water Sustainability Foundation
If you are concerned about algal blooms in Lake of the Woods or algal blooms anywhere for that matter, then you will hear a great deal about phosphorus concentrations and phosphorus loads. The difference is almost straightforward:
| Concentration – Describes how much of a substance is in a given volume of water and, in the case of phosphorus, it is usually expressed as milligrams per litre, e.g., 0.020 mg/L, or as micrograms per litre, e.g., 20 µg/L. The phosphorus concentration in lakes is how we determine how susceptible the lake will be to algal blooms because phosphorus is the primary nutrient required for algae to grow. Lake trout lakes are typically less than 10 µg/L while more enriched lakes that sustain algal blooms will be 30 µg/L or higher. This is a generalization but there is no escaping the fact that higher concentrations of phosphorus favor algal growth. More about this later. |
A microgram is really small A microgram is the same as a part per billion. Let’s put that into perspective. The internet says that you can put 1,000,000 ping pong balls in a school bus. It’s true. So, to hold a billion ping pong balls you would need to fill 1000 school buses. Now to represent 10 µg/L of phosphorus (and let’s have these be green ping pong balls), it would mean that there are 10 green balls somewhere in those 1000 buses. Is it difficult to analyse water samples for such low levels of phosphorus? You bet! |
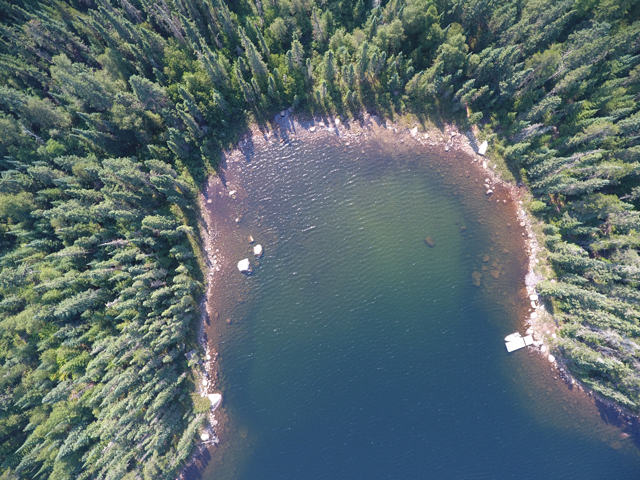 Ultra-clear waters of Lake 224. Photo courtesy of IISD Experimental Lakes AreaLoad – Describes the total quantity of a substance that is being delivered into a lake or river within a certain period such as per day or per year. You need to know the volume of water and the concentration in the water. You multiply these together and you get a weight or load. The load may be any quantity from grams to metric tons. The Rainy River, because of the high volume of water, delivers around 500 metric tonnes of phosphorus to Lake of the Woods each year. This is a load. Loads can be determined for inputs such as rainfall, erosion, runoff, etc. You normally combine individual loads to construct a phosphorus budget for a lake. If you do your best with the calculations, there are models that will then allow you to predict the in-lake concentrations of phosphorus based on the loads. This is important because algae growth responds to concentration – how much “food” is available – not the load. You can go ahead and measure phosphorus concentrations in the lake to see how close your predictions are to reality.
| Loads Determine Concentrations – You can see now how increased loads from various sources will lead to increased concentrations in the lake or river. The enrichment of a water body to a more productive state is called eutrophication. We mostly don’t want this because it can lead to algal blooms and oxygen depletion in deep water. But how do we know when loads and their resulting concentrations are too high? For this, we look to the trophic status index. This is a scale that describes concentrations against narrative or measured in-lake conditions. Generally, clear Lake Trout type water bodies, such as Whitefish Bay and the Clearwater Bay region have phosphorus concentrations less than 10 µg/L and such lakes are referred to as oligotrophic lakes. Ontario’s Provincial Water Quality Objectives (PWQOs) state that lakes having less than 10 µg/L phosphorus should be maintained below this value. Lakes with 10 to 20 µg/L phosphorus are often called mesotrophic lakes and the PWQO regards 20 µg/L as the concentration below which nuisance algal blooms are unlikely to occur. There are various concentrations used to describe eutrophic systems (the ones with algal blooms) but you often see 30 µg/L used as a guideline. It is important to realize that there are many of these indices in use by regulators in North America and they generally all use this 10, 20, 30ish scale. This is because the numbers line up very well with observed data. |
It’s all Greek to me Lakes are described on a scale of how nutrient rich they are. This is called the trophic status index from the ancient Greek trophikos meaning food or nourishment. The Greek prefixes oligo (few or scanty), meso (middle or moderate), and eu (well or rich) give us the scale:
|
Managing Concentrations – Managing phosphorus concentrations in lakes and rivers usually takes one of two forms. The first is to maintain loads so that in-lake concentrations remain within an acceptable range. The second is to adjust loads so that unacceptable concentrations can be reduced. The latter is the more daunting task. That process goes like this:
Unacceptable conditions such as algal blooms are linked to measured phosphorus concentrations which are deemed to be too high on the index.
- A more acceptable concentration of phosphorus is determined – a water quality objective.
- A phosphorus budget identifies the major sources (loads) of phosphorus to the system.
- Load reductions (targets) are set that would be required to reduce in-lake concentrations to the desired level.
- A strategy is developed to reduce loads from manageable sources.
- In-lake concentrations are improved.
This is a common process that has occurred successfully on large systems like Lake Erie and Lake Simcoe and on many smaller water bodies where point source inputs have been reduced to improve water quality. Lake of the Woods is currently being evaluated in a similar way to reduce the frequency and severity of nuisance algal blooms. Major initiatives for Lake of the Woods include Minnesota’s Phosphorus Total Maximum Daily Load study and Environment and Climate Change Canada’s science initiative in Lake of the Woods both of which aim to manage algae blooms by setting phosphorus reduction targets.
-------------------------
This article was written for the Lake of the Woods Water Sustainability Foundation by Bev Clark as part of the Foundation’s project: “Enhancing capacity for collaborative governance in the Lake of the Woods Basin”