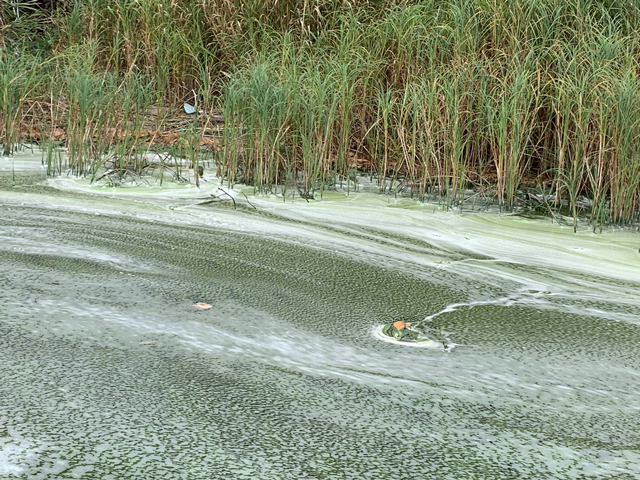
 Cyanobacteria scum near Treaty Island, Lake of the Woods on October 1, 2023. Photo: Kelli SaundersThe view from space is compelling and confirms what we have seen firsthand on Lake of the Woods at the end of September. The cyanobacterial bloom (aka blue-green algae) on Lake of the Woods is tracking towards being one of the most severe since 2002.
Bloom Extent
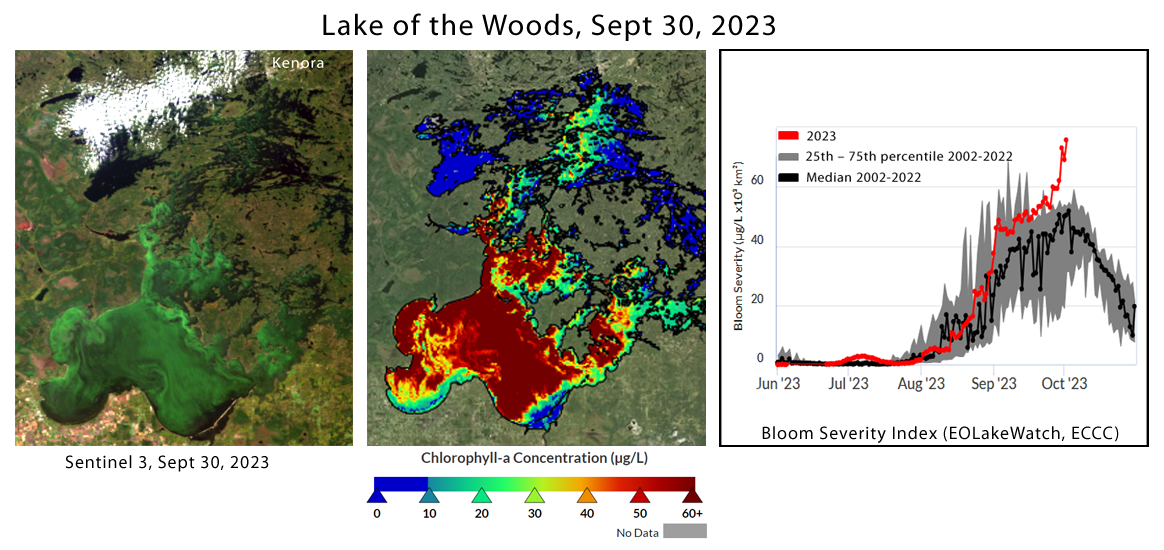
By late September, a massive bloom extended across 2,800 km2 or 73% of the lake’s surface (Figure 1, left panel). The bloom was extremely intense with satellite-derived measures of chlorophyll-a concentrations exceeding 60 µg/L over most of the southern and middle basins of the lake (Figure 1, centre panel). To put this into perspective, Minnesota’s lake eutrophication standard for chlorophyll-a is ≤ 9 µg/L and Canada’s threshold, based on world health guidelines, similarly is ≤ 10 µg/L.
 Figure 1. Sentinel 3 image of Lake of the Woods with severe algae bloom (left), satellite-derived chlorophyll-a concentrations (centre), and bloom severity index (right) for September 30, 20023. Chl-a and bloom severity indices from EOLakeWatch, ECCC.
A Severe Bloom
Bloom severity is an index that combines bloom extent and intensity (Figure 1, right panel). Severity has not only been above average but has exceeded the 75th percentile since mid-September, with exceedance increasing dramatically by October 2. Algal blooms in Lake of the Woods now typically peak in the fall, starting in the Big Traverse and progressing into the north-central area of the lake south of Kenora. Timing of the bloom has changed over the period of 2002 to the present, with a significant trend towards bloom severity peaking later in the fall (i.e., mid October in recent years since about 2010) vs. late summer (late August – early September).
Factors in Bloom Formation
Longer periods of warm weather in the fall are likely contributing to the later fall peaks. In a recent LOWWSF Ask an Expert webinar (lowwsf.com/ask-an-expert), Dr. Scott Higgins of the IISD-ELA reported that mean annual temperature in our region has risen 1.5°C since 1970. The greatest warming has not been in the summer but in the fall and winter. Longer, warmer falls are likely contributing to these late season algae blooms. If the warm weather and low winds conditions continue, development of more substantial blooms throughout the lake, including at the north-central basin is expected.
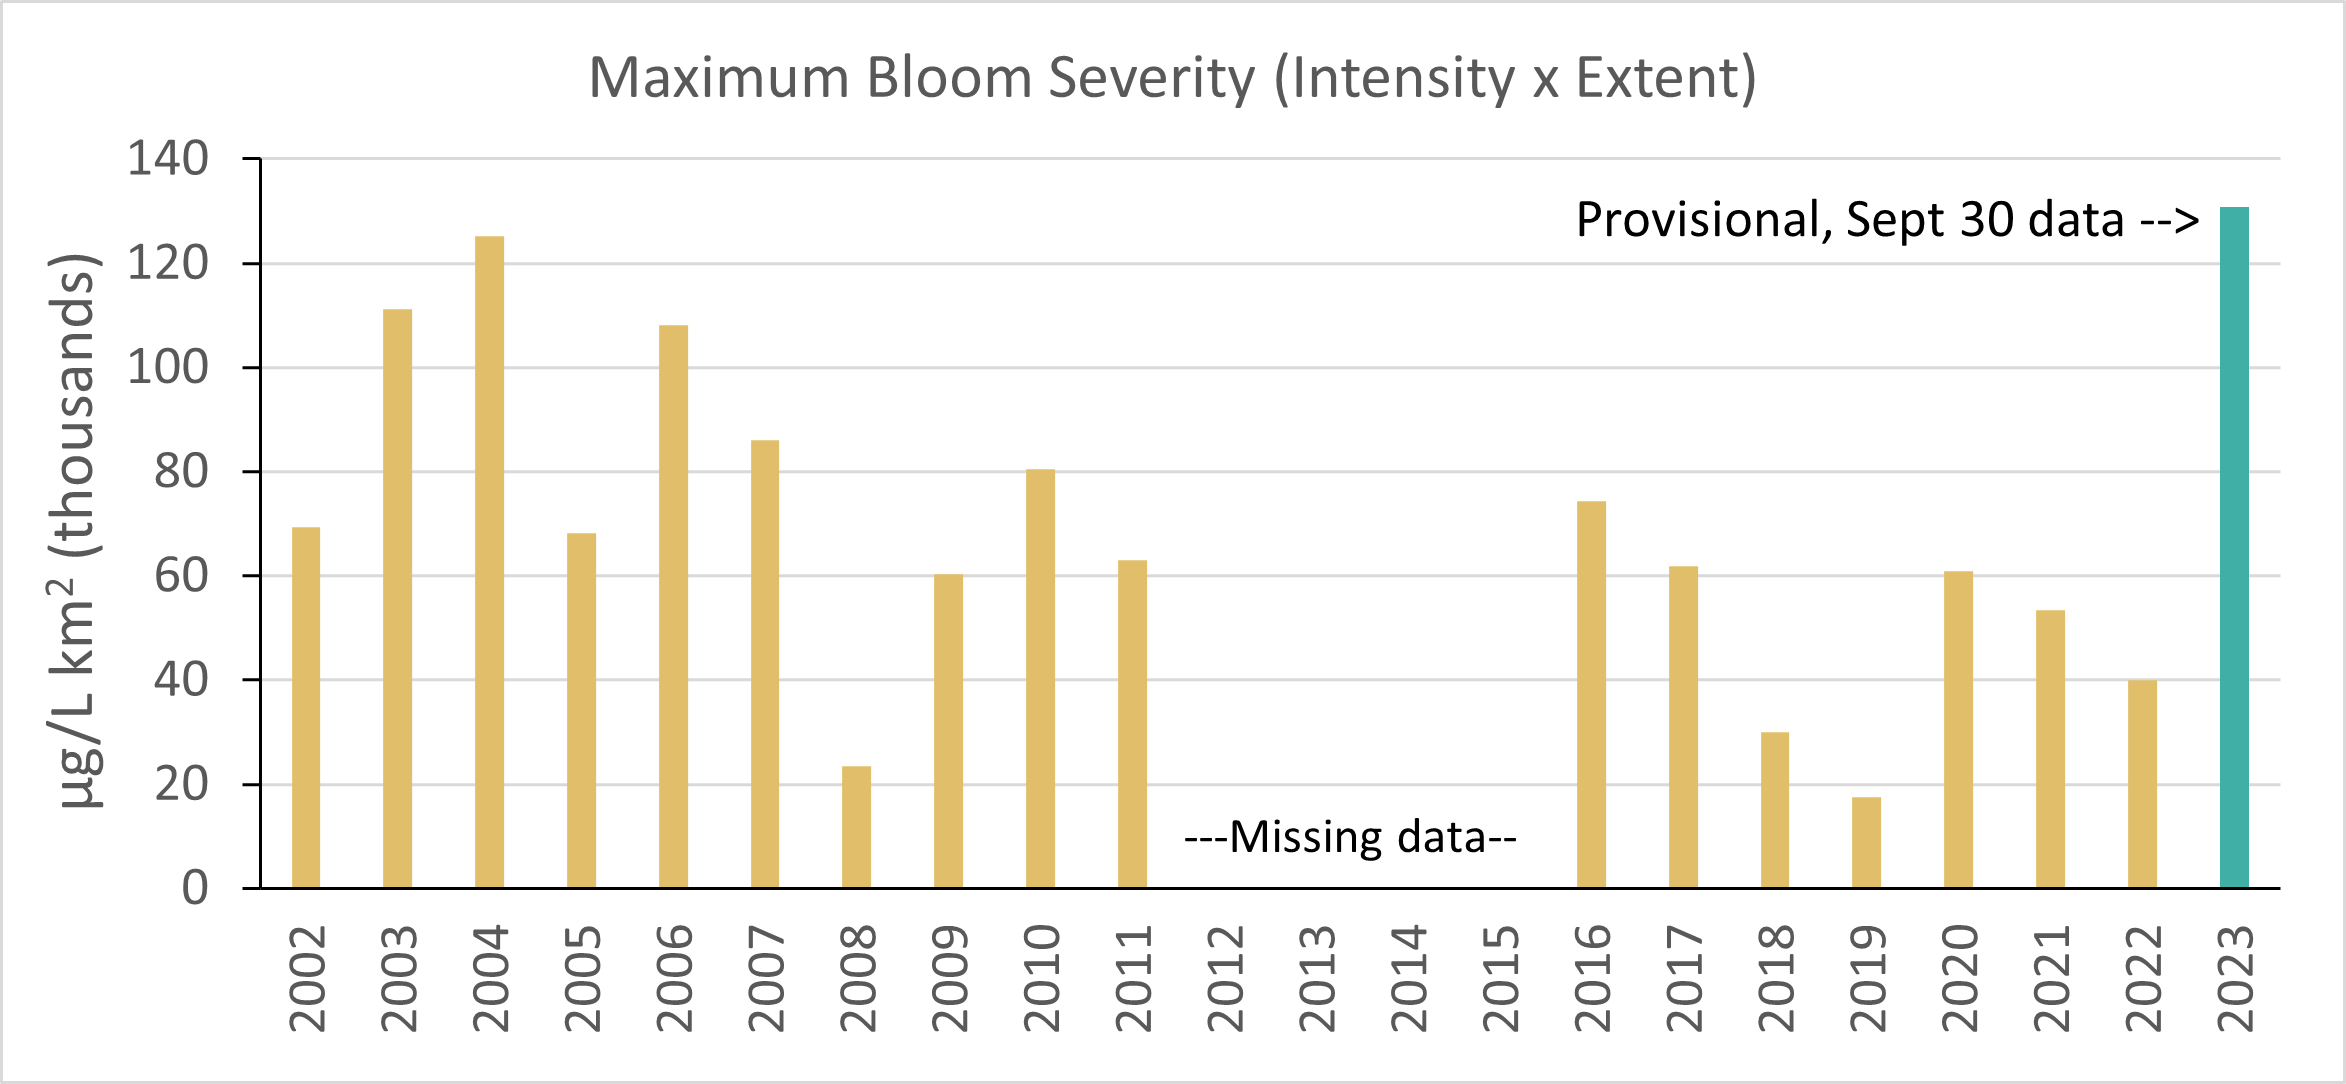
There is significant variability in bloom severity from year to year. After a few years of moderate blooms and a hint of a trend towards reduction in bloom severity since the mid 2000s, the maximum severity experienced this year so far, exceeds the worst in the satellite records (2002 – present, Figure 2). Figure 2.. Satellite data showing maximum bloom severity on Lake of the Woods (2002-2023), calculated by multiplying bloom extent (km2) by bloom intensity (μg/L chlorophyll). Units are x103 μg/L km2 (ECCC EOLakeWatch). Data for 2023 are provisional, based on maximum to date (September 30).
Phosphorus is the primary nutrient fueling these cyanobacterial blooms. However, the factors contributing to bloom severity are complex and include multiple interactions between excess phosphorus with climate (temperature, wind, extreme rain events, and lake water levels). Sources of phosphorus are many but with respect to these late season blooms, elevated phosphorus concentrations building up over the summer from remobilization from the lake bottom is a key driver. We are still paying for our sins of past decades of uncontrolled pollution that accumulated in the sediments of the lake.
There is much good news.
Current phosphorus loading from point and non-point sources has declined about three-fold over the past few decades from improved regulation. Also, research has shown that the pool of legacy phosphorus in the lake bottom is declining, albeit slowly. It will be important to maintain the reductions from new sources from the watershed so that the lake will continue to flush itself. Minnesota is implementing its plan to cut phosphorus further from sources in the US.
Now that Canada has completed its science to support domestic targets, we will be looking for complementary actions by Canada with its recent establishment of the Canada Water Agency, which has Lake of the Woods in its mandate.
