The history of the Rainy River is fascinating. How could it not be with voyageurs and lumberjacks all tangled up in it. The overlooked part of any history lesson, however, is often the timeline of environmental insults that occurred in concert with the industrial revolution and the population of the land and exploitation of its resources. The picture at left shows wood fibre mats downstream of the mills in 1952 - a shocking image of the conditions in the river that led Canada and the USA to have the IJC establish a pollution board for the River, the precursor of today's International Rainy-Lake of the Woods Watershed Board.
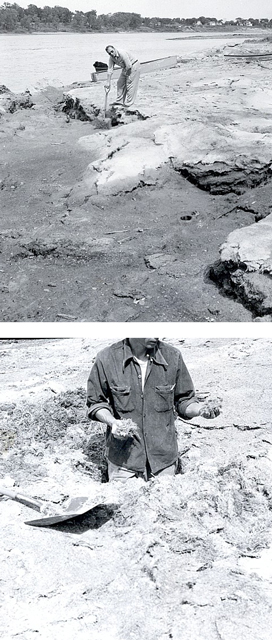 Fibre mats in the Rainy River downstream of the mills, 1952There was a great deal of progress between the invention of the steam engine in the early 1700s and the first Model T in the early 1900s - and a great degree of environmental damage to go along with it all. This happened almost everywhere. Increasing environmental insults up until around the middle of the 20th century followed by some second thoughts and the beginning of the process of cleaning up the messes. It wasn’t anybody’s fault really, it just took people a while to wake up. One interesting example of this process is the Chicago sewer and water and pig fat and river reversal story. You can read the history on that one if you have a strong stomach. But let’s get back to the Rainy River and have a look at its environmental insults timeline.
There were people tramping around the Rainy River in the 1600s. Not the first people of course but the first people trying to figure out how to make money. This amounted to the frantic lugging of beavers to the east, but all was still relatively OK by the 1800s when Alexander Mackenzie called the Rainy River one of the finest rivers in the North West. By the end of the 1800s someone finally figured out how to lug a small sawmill onto the river and it was basically down hill for water quality from that point forward. No, we don’t have data to show the downward trend, but it seems like that is what happened.
Next, people started reading newspapers and just before World War 1 they got set up to make much needed paper on the Rainy River. So, the timeline here was increasing discharge of pollutants into the Rainy River from the 1920s up until the 1960-70s. The pulp and paper industries in Fort Frances, Ontario and International Falls, Minnesota discharged large quantities of wood chips and fine particulate matter together with organic compounds into the Rainy River.
Sewage and other domestic wastes added to the mix. By the late 1950s, pollution of the Rainy River was dire enough for both Canada and the United States to bring in the International Joint Commission to study the problem and ultimately in 1966 to establish an international pollution board for the River. Water treatment upgrades greatly reduced these loads beginning in the early 1980s (and it was not just pulp and paper mills because people make sewage and other bad things that its just easier to get rid of by throwing it into the river).
Biochemical oxygen demand (BOD) is a process whereby oxygen in the environment is used up by the bacteria that are trying to break down all the extra organic material in the river. High BOD is bad because it starves the natural organisms of oxygen. BOD loads in the river if you track them since the 1960s also indicate quite nicely how the mess is being cleaned up (Figure 1 from Beak 1990).
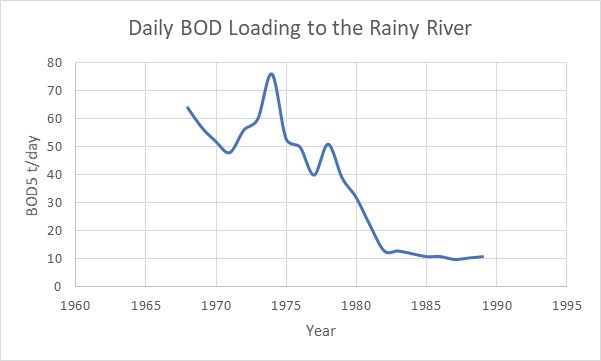 Figure 1: Daily biological oxygen demand (BOD) loading to the Rainy River, 1960s - 1980s (Beak 1990)
This cleanup process has been equally effective for other pollutants as well. In a review report Beak showed the mean concentrations in ten-year segments for several measures of concern and all showed improvements between the 1950s and the 1980s (Table 1).
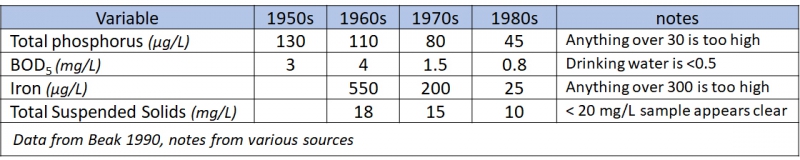 Table 1: Average decadal concentrations of selected substances in the Rainy River
Recent data from the Minnesota Pollution Control Agency (2014) show 86% decreases in total phosphorus and 75% decreases in Total Suspended Solids between 1953 and 2010. In data collected by Environment Canada, the number of times that water quality criteria was exceeded for total phosphorus declined from 68% for the period between 1979-1985 to 19% for the period between 2009 and 2011. This is clearly an improvement and steps are currently underway to reduce total phosphorus loads through a Minnesota, Total Maximum Daily Load initiative which has been described elsewhere. So, you might ask “Why didn’t we get on this earlier?” Part of the answer to that is that the scientists at the Experimental Lakes Area figured out that phosphorus was the element that controlled the growth of algae in the early 1970s. Not that long ago - and well into this period of record. We just didn’t know for sure what was going on with algal blooms till the mid 1970s. And they are still a bit of a puzzle.
In 2011, Kathryn Hargan (research scientist) estimated that the two largest sources of phosphorus to the Rainy River are Rainy Lake and the Little Fork River. Point sources include seven municipal sewage treatment plants and two pulp and paper mills. These two mills at the time were the largest human source of phosphorus to the Rainy River at about 16%. Phosphorus concentrations generally increase in a downstream direction in the Rainy River due to additional non-point sources from agricultural runoff and erosion. Even with all this, the total phosphorus loads to the Rainy River have declined dramatically since the 1960s (Figure 2).
 Figure 2. Phosphorus loads to the Rainy River between ~1960 and 2010 (Rainy-Lake of the Woods State of the Basin Report, 2014)
Many of the recent “State of the Resource” documents list aquatic ecosystem health priorities such as – nutrients, contaminants, aquatic invasive species and climate change. Some of these issues such as nutrients and contaminants lend themselves to cleanup by limiting point source loads as we have seen above while others like the threat of aquatic invasive species or the impacts due to climate change are much more difficult to manage.
The problems involved with contaminants can also be difficult to manage. Sulphate is a good example. In 2009 through 2011 the sulphate concentrations at the outlet of the Rainy River ranged between 2.6 and 12.9 mg/L (Environment Canada). The median at 5.6 mg/L is considered fine for this area. But there are concerns about future acid mine drainage additions of sulphate to the watershed. This is a concern because sulphate can increase the rate of phosphorus release from lake sediments and it can also increase the transfer of mercury to more biologically available forms. Currently Minnesota has a sulphate guideline of 10 mg/L for the protection of wild rice. Concentrations are currently below the Minnesota standard but these may increase with future, increased, mining activity in the basin.
The situation where the Rainy River was pristine to begin with followed by a period of industrialization where water quality suffered, followed by a cleanup effort that greatly improved water quality and supported the recovery of walleye, sturgeon and other fish leaves us at a point where both congratulations and some concern are in order. We have come a long way and the cleanup of the Rainy River is an example that shows what coordinated international efforts can achieve. However, the Rainy River is still not what it once was and now we have climate change, invasive species and other stressors to deal with. Will we be able to wake up again? Time will tell.
 This article was written for the Lake of the Woods Water Sustainability Foundation by Bev Clark as part of the Foundation’s project: “Enhancing capacity for collaborative governance in the Lake of the Woods Basin”