We’ve learned a lot about phosphorus in Lake of the Woods over the past decade. Volunteers who take water samples as part of Ontario’s Lake Partner Program are key to what we know about phosphorus in Lake of the Woods and throughout the entire watershed. The Foundation is bringing you a two-part series on the value that Lake Partner Program volunteers contribute to unlocking the phosphorus story throughout the watershed. Bev Clark, an environmental scientist and consultant who has worked on Lake of the Woods and with the Foundation for many years, presents the Lake of the Woods story in Part I. In Part 2, we will focus on the upstream waters that feed into Lake of the Woods, including the Rainy River and beyond – Todd Sellers, LOWWSF Executive Director.
By Bev Clark, for the Lake of the Woods Water Sustainability Foundation
 Collecting water samples for phosphorus analysisWe need to monitor the phosphorus (P) concentrations throughout the Rainy-Lake of the Woods watershed because we are concerned about algal blooms. Higher concentrations in any given area mean that there is an increase in the likelihood of nuisance blooms in those areas. That is because P is the primary nutrient that stimulates algae growth. Climate also influences algal blooms but the link between phosphorus and bloom intensity remains.
Many groups collect P data in the watershed and these results are summarized periodically in our State of the Basin reports. These reports invariably list nutrients, in this case P, as a priority issue. So, what are the P concentrations like in the water throughout the watershed? Luckily, we don’t need to sift through the data from a bunch of agencies or pour through reports to figure it out. The Ministry of Environment, Conservation and Park’s Lake Partner Program volunteers monitor more than 130 locations throughout the watershed and these data are available online in an interactive map or you can download datasets for (phosphorus, secchi depth, calcium). These data are the gold standard because they are analysed in a lab that has results that are about ten times more precise than any other lab in the province. Let’s have a look at what the data are telling us about Lake of the Woods.
There are several ways to interpret water quality data. You can look at averages within areas, such as in isolated bays, trends from year to year or maybe seasonal variation in a given spot. For this summary, I wanted to look at variations from place to place in the present-day concentrations. Concentrations have changed through time in many areas and if we want to speculate about the likelihood of algal blooms then we need to look at present-day conditions. I used the most recent data (the last 5 years) for areas where there are long records and the best available data for areas where there is a shorter record. No data are older than 20 years and much of it is current. There are seasonal variation data for some locations and, although seasonal variation may play a role in bloom cycles, the topic is too dense to dive into here, so I just averaged all the newest data for each location. Then I did one more thing. I divided the sites up into trophic status categories and assigned colours to the site markers depending on how nutrient-rich the water was. Water with less than 20 µg/L phosphorus got a blue marker. This is water that the Ontario Provincial Water Quality Objectives (PWQOs) indicate should be at reduced risk of nuisance algal blooms. Water with 20-30 µg/L got a green marker. These concentrations are OK for rivers but too high for lakes according to the PWQOs. Finally, the concentrations over 30 µg/L (micrograms per litre) got a red marker and, well, you know what red means. Let’s examine, in more detail, the Lake Partner Program phosphorus data for just Lake of the Woods – the south section and the north section. We can make maps that show at a glance the degree to which different areas of the lake might be susceptible to algal blooms.
The south portion of Lake of the Woods
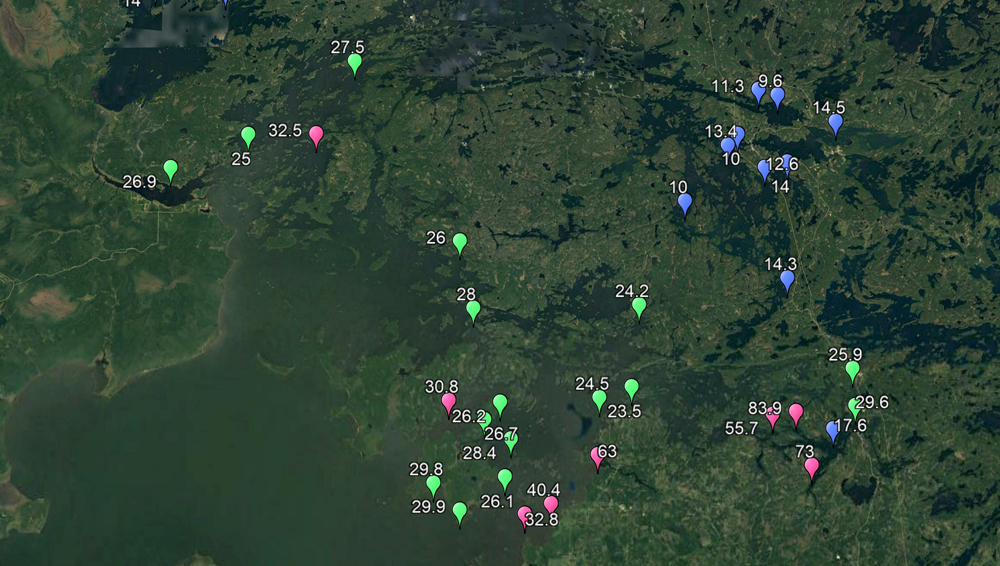 (click to enlarge) Figure 1 – Phosphorus concentrations in the south portion of Lake of the Woods. Green markers are concentrations between 20 and 30 µg/L which is higher than the PWQOs recommend and red markers indicate concentrations >30 µg/L.For the southern portion in Ontario, these data are shown in Figure 1. Many locations have a range in concentrations between 20 and 30 µg/L. This is not surprising, given the volumes of water entering the lake from the Rainy River that are well above 30 µg/L. There are many concentrations measured over 30 µg/L (the red markers). You can see that the 20-30 µg/L water is working its way up the central portion of the lake towards the north. It is also clear that the isolated Whitefish Bay areas connected to the north end of the lake have lower phosphorus concentrations. These are the blue markers in the top right areas of Figure 1.
The north portion of Lake of the Woods
These data are shown in Figure 2. Most of the measurements in the north end of the lake are below 20 µg/L indicating acceptable water quality. You can see that water arriving from the south has produced concentrations in the central areas that are over 20 µg/L (the green markers) and these exit the lake into the Winnipeg River at concentrations between 20 and 30 µg/L. These concentrations are getting high for the lake near Kenora but once again OK for river environments since the PWQO for phosphorus in rivers is 30 µg/L (the green markers at the top of Figure 2).
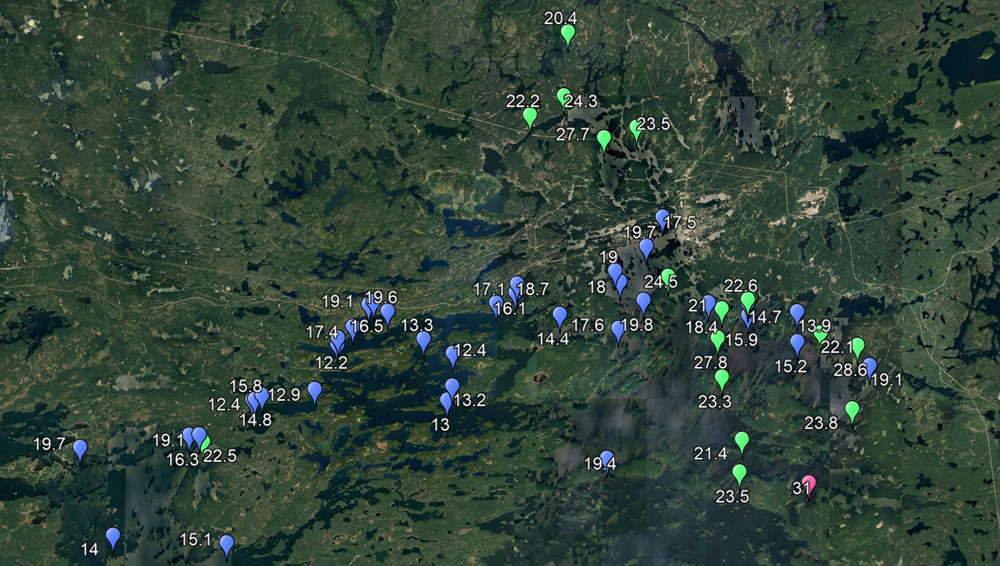 (click to enlarge) Figure 2 – Phosphorus concentrations in the north portion of Lake of the Woods. Most concentrations are below 20 µg/L (the blue markers).
So, what does this all mean?
The simplest take away is that many areas are in good shape (the blue markers) and many areas, especially in the central areas of the lake, are higher but maybe not too high considering that this is, for the most part, a mesotrophic system (see Table 1) with higher nutrient water (and excellent fishing). These are areas with the green markers. Then there are the red markers and we may need to deal with those because, well, red is not good.
|
Oligotrophic |
TP concentrations generally <10 µg/L |
Think clear water, Lake Trout |
|
Mesotrophic |
TP concentrations generally 10-20 µg/L |
Less light penetration, Walleye |
|
Eutrophic |
TP concentrations generally >30 µg/L |
Algal blooms, scums, bass |
Table 1 – Trophic status boundaries. These are guidelines used to describe general water quality conditions. Interpretations may vary between different areas. In Ontario we think of lakes over 10 µg/L as being mesotrophic but the boundary for eutrophic systems is less well defined. Sometimes eutrophic systems are classed as hyper-eutrophic if TP concentrations are very high or well above 30 µg/L.
Those of you who volunteer as Lake Partners and sample water for this provincial program are contributing to a long-standing, widespread, incredibly valuable database and we thank you for your continuing effort. Scientists and researchers can only do so much, but the consistency and integrity of this source of data allows us to paint this picture of water quality conditions on Lake of the Woods for all to see. For more information on the Lake Partner Program or to sign up as a volunteer, go to https://www.desc.ca/programs/LPP.
-------------------------
This article was written for the Lake of the Woods Water Sustainability Foundation by Bev Clark as part of the Foundation’s project: “Enhancing capacity for collaborative governance in the Lake of the Woods Basin”