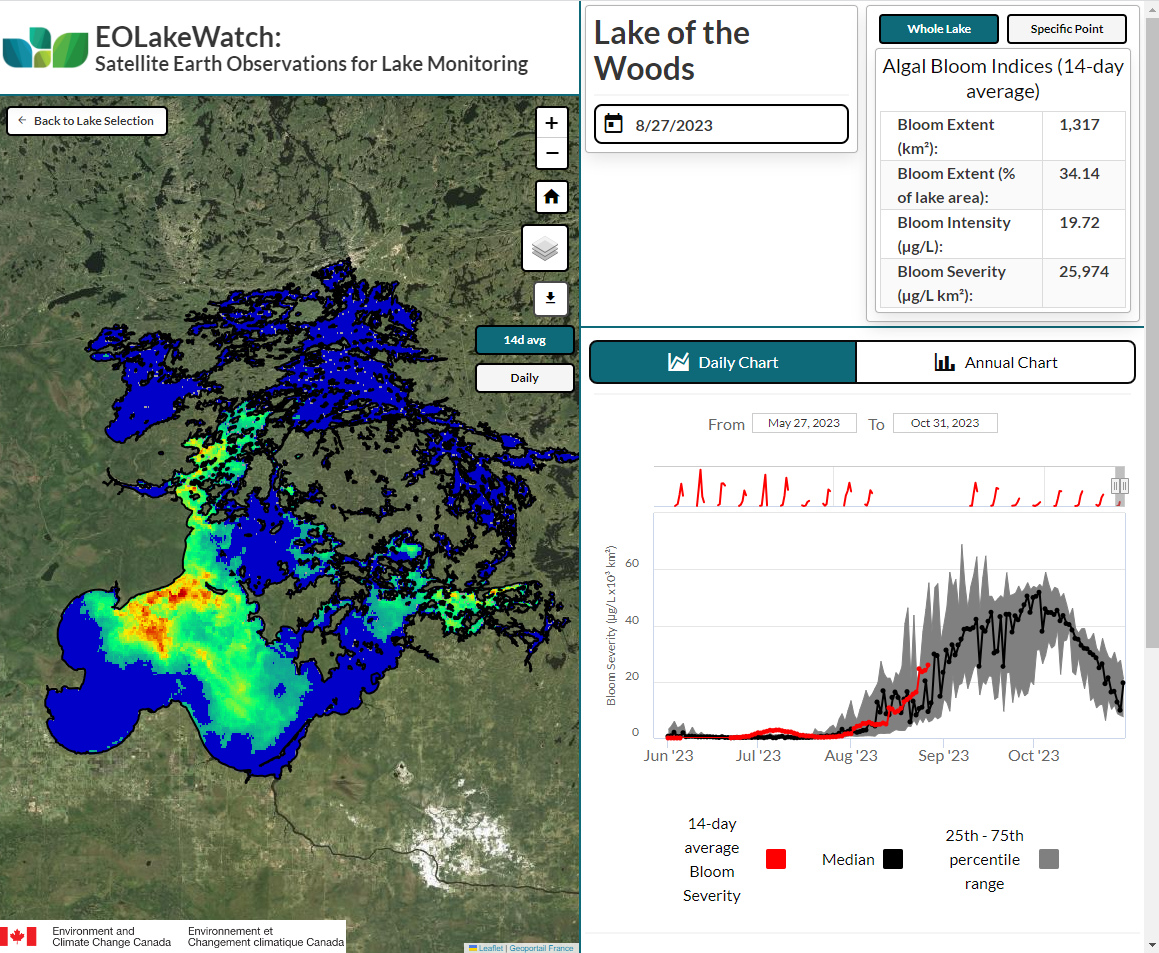
 A sneak-peak at the enhanced version 2.0 EOLakeWatch satellite algae monitoring online tool currently in development by Dr. Caren Binding at Environment and Climate Change Canada.We’ve all seen the compelling satellite pictures of blue green algae blooms covering Lake of the Woods. As part of the Environment and Climate Change Canada’s Lake of the Woods Science Plan (2016-2020), Dr. Caren Binding developed a system to harness these images for near real-time tracking of algae blooms and computation of indices of bloom severity, intensity and extent across the lake. At that time, Dr. Binding launched an online tool, ECCC’s EOLakeWatch, for public access to this information. I highly recommend you check it out!
Coming soon is a “version 2.0” of the EOLakeWatch interactive visualization and data portal for the satellite image processing system. I’ve had an opportunity to view the beta version and am very impressed. It provides ability for the public to display and download maps, charts and data on bloom indices that can be customized to visually show daily values, 14-day averages, and current year blooms compared to the historical values from 2002 and on.
These indices and tools will be extremely useful in monitoring and measuring the effectiveness of efforts to cut phosphorus to reduce harmful algae blooms. Fantastic stuff! We’ll let you know when the upgraded online tool is available. For now, I highly recommend you check out the current version and subscribe to the EOLakeWatch email list for bloom updates.
https://www.canada.ca/en/environment-climate-change/services/water-overview/satellite-earth-observations-lake-monitoring/interactive-algal-bloom-monitoring-tool.html
